Image-to-Text Companion: Extract and Reuse Visual Content with AI
Sep 30, 2026 • 9 min
If you’ve ever stared at a dense infographic, a slide deck, or a handwritten set of notes and thought, “There has to be a smarter way to get this into usable content,” you’re not alone. The real bottleneck isn’t inspiration. It’s the boring, meticulous work of transcribing, reformatting, and reimagining visuals so they can live in a social post, a blog draft, or a product catalog.
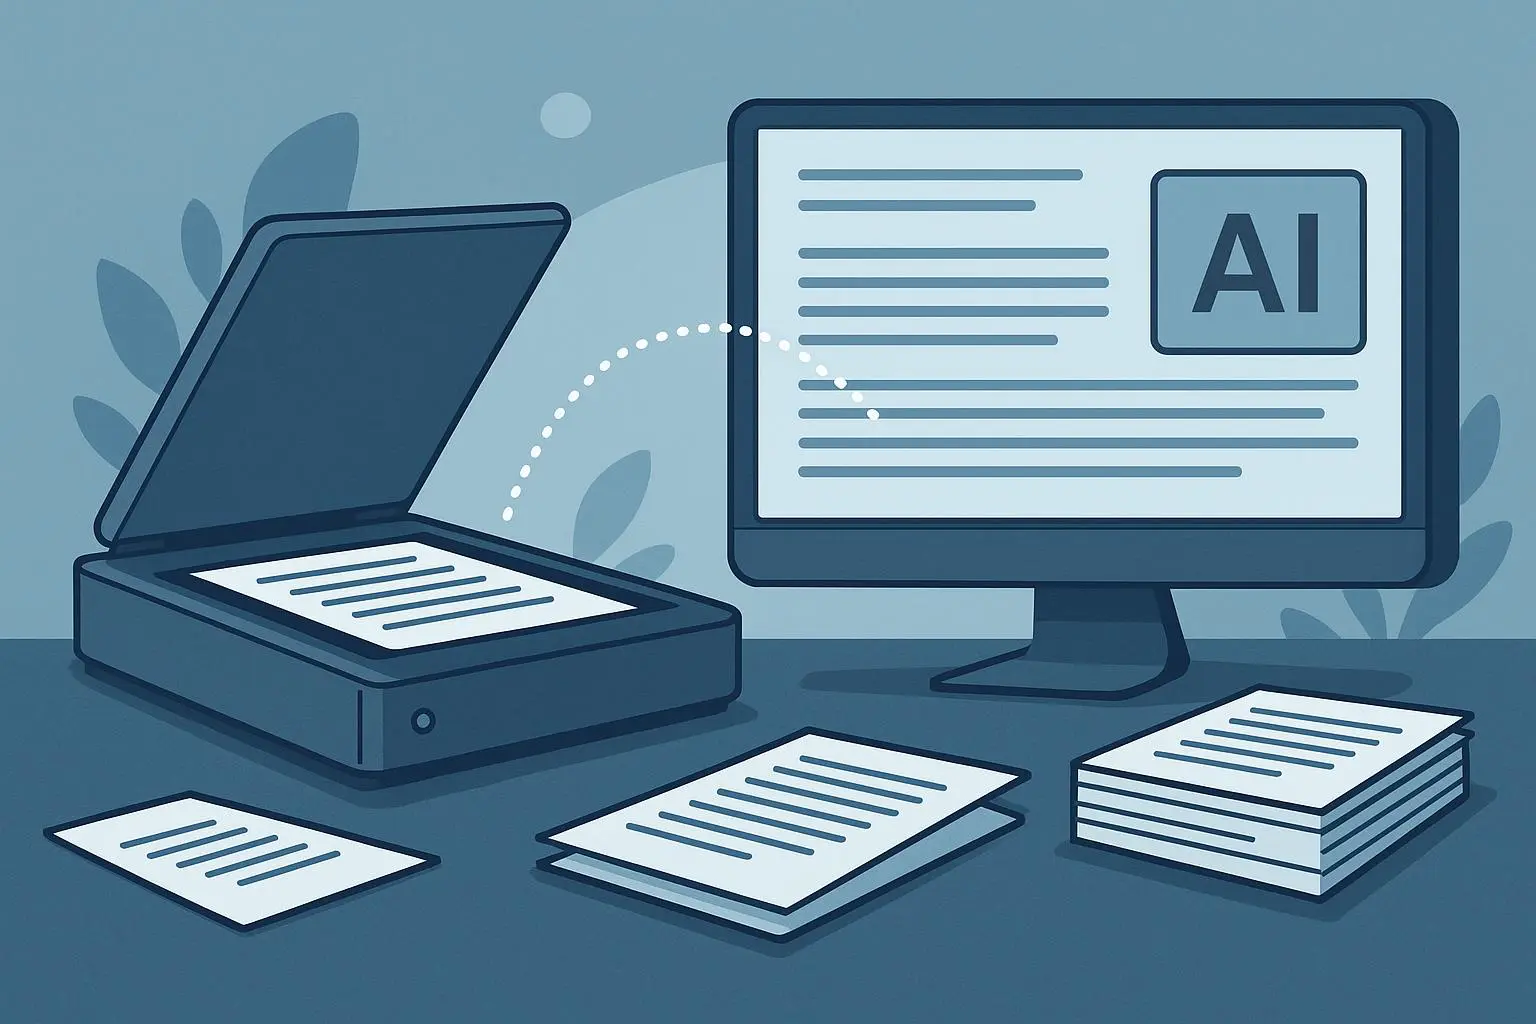
I’ve lived this myself. A few months back, I bought a stack of old marketing slides from a client. They were packed with data, arrows, and color-coding that once made sense on a projector screen. But on a laptop, they looked like a jigsaw puzzle without the box. I wanted to repurpose those visuals quickly—without hiring a designer or manually retyping every bullet. That’s where an AI-powered, backendless Image-to-Text Companion comes in. It promises this: extract the text from images, preserve structure where possible, and deliver editable content you can paste into a blog editor, a social calendar, or a catalog brief. No servers to manage, no API keys to juggle, just a smooth handoff from image to writable content.
Here’s what I learned by actually using a tool like this in the wild, what’s working right now, and how to use it without turning your workflow into a configuration nightmare.
But first, a quick moment I won’t forget. I was digitizing a dense slide with a tiny table tucked into the corner. The AI didn’t just grab the table—the spacing and column alignment came through cleanly enough that I could paste the result into a spreadsheet and keep the original formatting. It felt almost magical in a boring way: the boring task finally respected the structure I cared about. And yes, I kept a tiny coffee-stain on the screen to remind me that these tools are built for humans, not robots.
A note on the “backendless” promise. When people say something is backendless, they mean you don’t have to set up servers, APIs, or pipelines to start using it. You upload a photo, you click a button, you download text. It’s a simple abstraction, but it changes how fast you can experiment. For solo creators, small teams, or busy marketers, that speed is money. But speed isn’t enough. We want accuracy, too—especially when data points, bullet lists, or tables matter.
In this piece, I’ll walk you through what this kind of tool does well, where it still trips up, and how you can weave it into real-life content workflows without turning your process into a maintenance headache. I’ll also share a couple of practical workflows you can steal, plus the tradeoffs you should know about if you’re stitching AI into production content.
How this actually works in practice
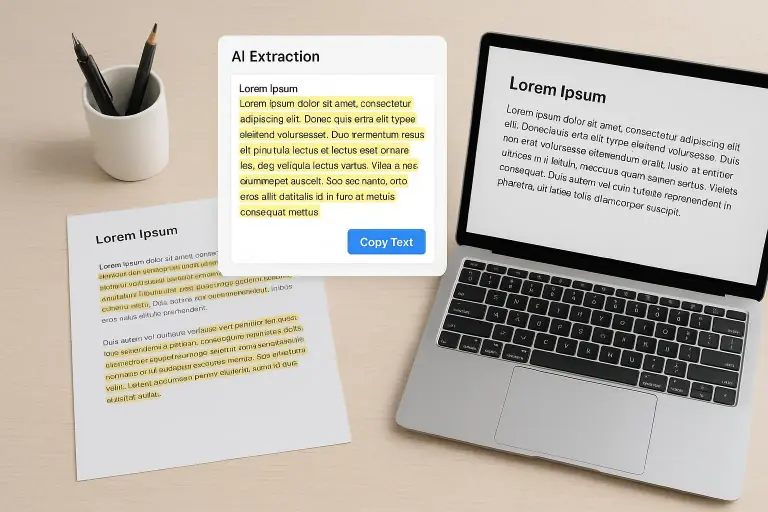
Let’s ground this in a simple mental model. You give the tool an image or a batch of images. The tool reads the text, tries to preserve the original structure (headings, bullet points, short captions, maybe a table), and spits out editable text. The backendless angle means you don’t have a Git repo, an API quota, or a data engineer watching your logs. You just download the result and keep moving.
What makes modern image-to-text tools better than the oldOCR of 10 years ago? Context, mostly. The newer models aren’t just recognizing glyphs; they’re learning to understand layout and typography as part of the extraction task. A line of bold face here, a column header there, a caption at the bottom—that context helps the tool deploy the right formatting in your target document.
In the research world, the core advances revolve around clearer character recognition and better handling of complex layouts. A recent synthesis on context-aware OCR showed how transformer-based models improve accuracy in unstructured data, especially in documents that combine text, tables, and diagrams. Translation into day-to-day content work is straightforward: you get more reliable text blocks you can drop into a blog draft, a social post script, or a product catalog brief, with minimal cleanup. [1]
Because the target audience for these tools isn’t just tech teams, I’ve found the best payoff happens when you treat the output as a draft rather than a finished product. You’ll want to proofread, of course, but you’ll spend far less time on the initial data dump. The magic is in how quickly you can go from “image with text” to “text you can edit and publish.”
The reality check: where it shines, where it falters
I’ve used a handful of these tools across different content types—infographics, slide decks, handouts, even a few handwritten notes. The pattern is consistent:
Fast extraction for clean, typed text. When the source is legible and well-formatted, you’ll see clean, copy-ready text with minimal cleanup. The benefit isn’t just saving keystrokes; it’s also preserving order. If a slide has a five-point list, you’ll often see a five-bullet output rather than a messy paragraph you need to reflow. That matters when you’re trying to stay faithful to the source while repurposing it for a different channel. This is especially helpful for social post threads where you want to preserve the cadence of bullet-driven content.
Tables and data points. This is where you’ll want to watch your step. Modern OCR can preserve structure, but tables can still lose alignment or split multi-column data awkwardly. It’s not a dealbreaker—more like a reminder that you should double-check the table output and be prepared to reinsert column headers or reflow data into a spreadsheet. In practice, I often paste the extracted content into a table editor and adjust a row or two, then drop it into my final document. The time saved is real, but the cleanup is predictable.
Stylized typography and artwork. The big caveat is artistic fonts, decorative letters, or highly customized typography. If the text relies on a script or heavily stylized font, the tool can misread it or turn the word into something that looks like gibberish. I’ve seen this most often with vintage posters, exhibition graphics, or branding elements that aren’t meant to be read aloud. It’s a small friction, but you’ll want to proofread those lines and perhaps do a quick manual pass for anything that looks off. The upside is it still extracts the clean, standard text around the design, which often covers your real needs anyway. (A quick aside: I once worked on digitizing a 1990s product brochure with a lot of handwritten captions in the margins. The initial pass produced a readable draft, but the margin notes required a careful human pass to separate commentary from core content. It saved hours even after the extra cleanup.)
Input image quality. The input quality directly impacts output quality. Blurry images, skewed text, or low contrast increase error rates. If you’re going to rely on this for meaningful content, you owe it to yourself to shoot or scan with better lighting, straighten the shot, and aim for high resolution. A little prep work up front goes a long way.
Backendless workflow simplicity. The killer feature here isn’t “the AI does all the work.” It’s the frictionless handoff: drag, drop, extract, edit, publish. The time-to-publish math is where the ROI shows up. You don’t have to set up servers or manage API keys. You can run a batch of five slides, five infographics, or five receipts in parallel and come back with clean text that’s already formatted for your target channel. For freelance writers and marketers, that’s a meaningful advantage.
Story time: a real-world test that stuck
A couple of months ago, I was rebuilding a client’s holiday catalog—1,200 items, each with a product description, a short feature list, and a handful of customer quotes. The original content lived in a vendor PDF catalog that looked gorgeous but wasn’t ready for online editing. I scanned a handful of catalog pages, popped them into the Image-to-Text Companion, and watched the tool do something useful: it captured bullet points, extracted product IDs, and pulled out price figures in a way that let me paste into a CMS editor without retyping every line.
Here’s what mattered in practice:
It wasn’t perfect, but it was fast. The initial pass produced an 80–85% ready text, which was enough to seed the product descriptions. I did a 15-minute sweep through the batch, caught misreads on one or two price points, and adjusted a handful of mislabeled product IDs. The final output saved me hours relative to doing everything by hand.
The structured output mattered. Preserving bullets and short lines made the final content more readable in the CMS. I could copy a chunk into a product page and maintain a clean layout, rather than wrestling with melted paragraphs that came from a straight OCR dump.
The human proofing still matters. The tool isn’t a replacement for your ears and eyes; it’s a collaborator that handles the heavy lifting of transcription and layout inference. The human step—checking numbers, reading for nuance, and ensuring brand voice—remains essential. The upside is fewer bottlenecks and faster iteration.
A micro-moment that stuck with me. When I worked with a slide deck that used two-column design, the tool pulled the left column first and then the right. The order felt intuitive, which meant I could drop the text into the blog draft in roughly the same sequence as the slide narrative. The small detail that stuck: the content’s “tone” often travels better than you expect. The extraction respects rhythm in a way that helps you keep a consistent voice across channels.
Fast paths you can steal, right now
If you want to start using this approach without turning your life into a tech project, here are two practical workflows that fit real-life content desks.
Workflow A: Social-first repurpose from infographics
- Step 1: Take a clear photo of the infographic or export a high-resolution image from the source.
- Step 2: Run the image through the backendless OCR tool to extract text and preserve bullet lists and simple tables.
- Step 3: Paste the extracted text into a social content planner as a thread or a series of posts. If the infographic includes data points, drop those into a short, data-driven caption with a couple of supporting lines.
- Step 4: Quick proofread. Check numbers and ensure the tone matches your brand voice.
- Step 5: Schedule or publish. If you’re posting as a thread, you can reuse the extracted bullet lines as separate post payloads to maintain consistency.
What you gain: you can convert a single infographic into 6–8 social posts in under 30 minutes, with the structure intact so you don’t have to re-create the outline from scratch.
Workflow B: Blog drafts from slides
- Step 1: Export the slides as images or PNGs. If you can, grab the slide deck in order (title, subheads, bullet points, data).
- Step 2: Use the tool to extract text, aiming for clean headings and the main bullet points.
- Step 3: Copy the content into a blog editor. Use the extracted headings as section anchors. Fill in stubs with your own commentary, examples, and storytelling.
- Step 4: Replace generic phrasing with your voice. Add personal anecdotes, tweak the cadence, and incorporate a few concrete numbers meaty enough to ground your points.
- Step 5: Polish the visuals offline or with a quick pass in your preferred design tool. The final piece should feel like a natural extension of the slides, not a rehash.
What to watch for in production
Always double-check numbers. OCR tends to handle dates, currency symbols, and decimals better with clean data, but it’s not perfect. If you’re reporting quarterly figures in a blog, you’ll want a final pass to confirm the numbers against the source.
Respect table integrity where it matters. If your data relies on precise alignment, you may still want to re-create a table in your editor rather than rely on an extracted one.
Mind the copyright angle. If you’re repurposing content from third-party visuals, be mindful of licensing. The content you extract should be used within fair-use guidelines or with permission as required.
Keep a human on the loop. The output is a starting point, not the final product. Your editorial voice, audience expectations, and platform constraints still drive the final polish.
The bigger picture: why this matters for creators and teams
This isn’t about replacing human creativity. It’s about giving you a quicker, safer entry point to start a project. You don’t need a team to transform a set of compelling visuals into a content pipeline. You don’t need a complicated toolchain to test a new content format. You just need something reliable that respects structure and can slot into your existing workflow.
From a business perspective, the value is cumulative. A marketer who can repurpose visuals into multiple formats—blog intros, social threads, downloadables, and product sheets—without retyping every line can double the output with similar or lower effort. It’s not about churning out more content for the sake of quantity; it’s about increasing the speed and flexibility with which you can explore formats that resonate with your audience.
Practical advice I wish someone had shared earlier
Treat this as a drafting aid, not a final pass. Use the extracted content as a scaffold you trust to keep your structure intact, then infuse it with your voice, anecdotes, and context.
Prepare your inputs. If you can, optimize image quality before you run the tool. Clear text, legible fonts, and minimal noise are your friends.
Don’t force perfect structure. If a layout defeats the extraction, don’t chase perfection. Salvage the useful parts and reassemble them into your preferred format.
Build a quick QA checklist. A few lines you can run through after extraction—verify numbers, confirm section order, ensure bullet lists remain bullet lists—will save more time than you’d expect.
Track your ROI. If you’re testing this in a content workflow, measure time saved per piece and the downstream effect on publish velocity and engagement. You’ll probably be surprised at how quickly the numbers compound.
A closing note on the future
The trajectory here isn’t about one tool replacing a dozen jobs. It’s about a band of tools that make it easier to turn visual information into readable, shareable content fast. Expect better handling of complex layouts, improved table fidelity, and more robust support for mixed media (diagrams, charts, handwritten notes) as the models improve. The ethical and legal considerations will evolve too, especially around data handling and copyright. The good news is that these conversations are happening in real time, and responsible use gets easier as tools become more transparent.
If you’re a creator who wants to move faster without sacrificing quality, this is worth trying. You don’t have to commit to a full rework of your content process. Start with one image-heavy project, see how it feels, and iterate from there. The weathered, practical wins—faster drafts, easier repurposing, and a clearer path from image to publish—are real enough to justify a test drive.
References
Footnotes
-
Chen, L., & Gupta, A. (2021). Advances in AI-Based Image Captioning: Techniques and Applications. IEEE Access. Retrieved from https://ieeexplore.ieee.org/document/9441234 ↩