Advanced Tips: Optimize Your Rental Income Calculations and Scenario Modeling
Aug 14, 2026 • 9 min
If you’ve ever built a rental pro forma that looked solid on paper but fell apart in reality, you’re not alone. The problem isn’t your math—it’s your scope. Real estate cash flow lives in the gray area between assumptions and uncertainty. The illusion of a clean, linear path is what trips people up when markets swing, vacancies spike, or maintenance surprises pop up.
This is not a primer. It’s a practical guide for power users who want to run disciplined, multi-scenario analyses that actually inform decisions. Think of it as a toolkit you can pull out before you sign a loan, not after you’ve locked in a property.
A few years back, I bought a 12-unit in a mid-sized city that seemed like a slam dunk. I ran three scenarios, sure: Base, Optimistic, and Pessimistic. The Base Case looked fine, but the Pessimistic Case showed a crippling cash-flow shortfall once CapEx and turnover costs hit. I almost walked away. What saved me wasn’t luck; it was a structured stress test. I spent another week refining vacancy assumptions, tying expense growth to local indices, and building a more granular CapEx reserve. When I finally reopened underwriting, the deal penciled out with a margin I could defend to a skeptical partner. That experience taught me a simple truth: the strength of your model is in its edges, not its center.
And a micro-moment that stuck with me: while updating the model, I noticed a single line item—the turnover cost per unit—being understated by 40%. It wasn’t glamorous, but it changed the annual cash flow by thousands. That little revelation reminded me that the devil is in the details, especially when you’re juggling dozens of variables across multiple scenarios.
In this post, I’ll walk you through an approach that’s practical, testable, and repeatable. You’ll learn how to set up and compare at least three scenarios, stress-test vacancy and CapEx, and refine rent-growth forecasts so you’re not surprised when the market moves.
How I actually make this work
If you want to move beyond simple cap rate arithmetic, you’ve got to change how you think about risk. The most powerful modeling happens when you separate the decision criteria from the noise. You model, then you stress, then you decide.
Here’s the approach I use, broken into three core habits you can adopt this quarter.
1) Build three explicit scenarios—and treat them like laws
Base Case: This is your most likely outcome, grounded in current lease rollovers, local rent trends, and historically observed vacancy.
Optimistic Case: This imagines a favorable crew of conditions—higher rent growth, tighter vacancies, lower CapEx surprises. It’s a what-if to test appetite for risk.
Pessimistic Case: This is the real discipline test. It forces you to assume slower growth or negative rent pressure, higher operating costs, and larger CapEx overruns. If the Pessimistic Case still looks acceptable, you’re in a stronger position; if not, you know exactly what to tighten.
The trick isn’t to worship one outcome. It’s to see where the model breaks and to quantify the resilience of your investment.
A quick note on inspiration: the Reddit crowd has strong feelings about this. One investor put it plainly: “I stopped trusting any deal that didn’t survive a 15% vacancy rate and a 20% expense overrun. The Base Case always looks good; the stress test shows you where the foundation cracks.” That kind of sanity check is exactly what you’re aiming for.
Micro-moment: I once renamed a “sensitivity” tab to “Reality Check.” The change nudged a colleague to actually poke at the numbers instead of skimming, which dramatically reduced after-close surprises.
What to implement now:
- For each property, run Base, Optimistic, and Pessimistic projections across a 10-year horizon.
- Keep a single metric you care about for decision-making (e.g., cash-on-cash return or equity IRR) and compare across scenarios.
- Note where the Pessimistic Case hits your risk tolerance threshold (negative cash flow, debt service coverage dips below 1.0, etc.).
2) Stress-test vacancy and expenses with data, not rules of thumb
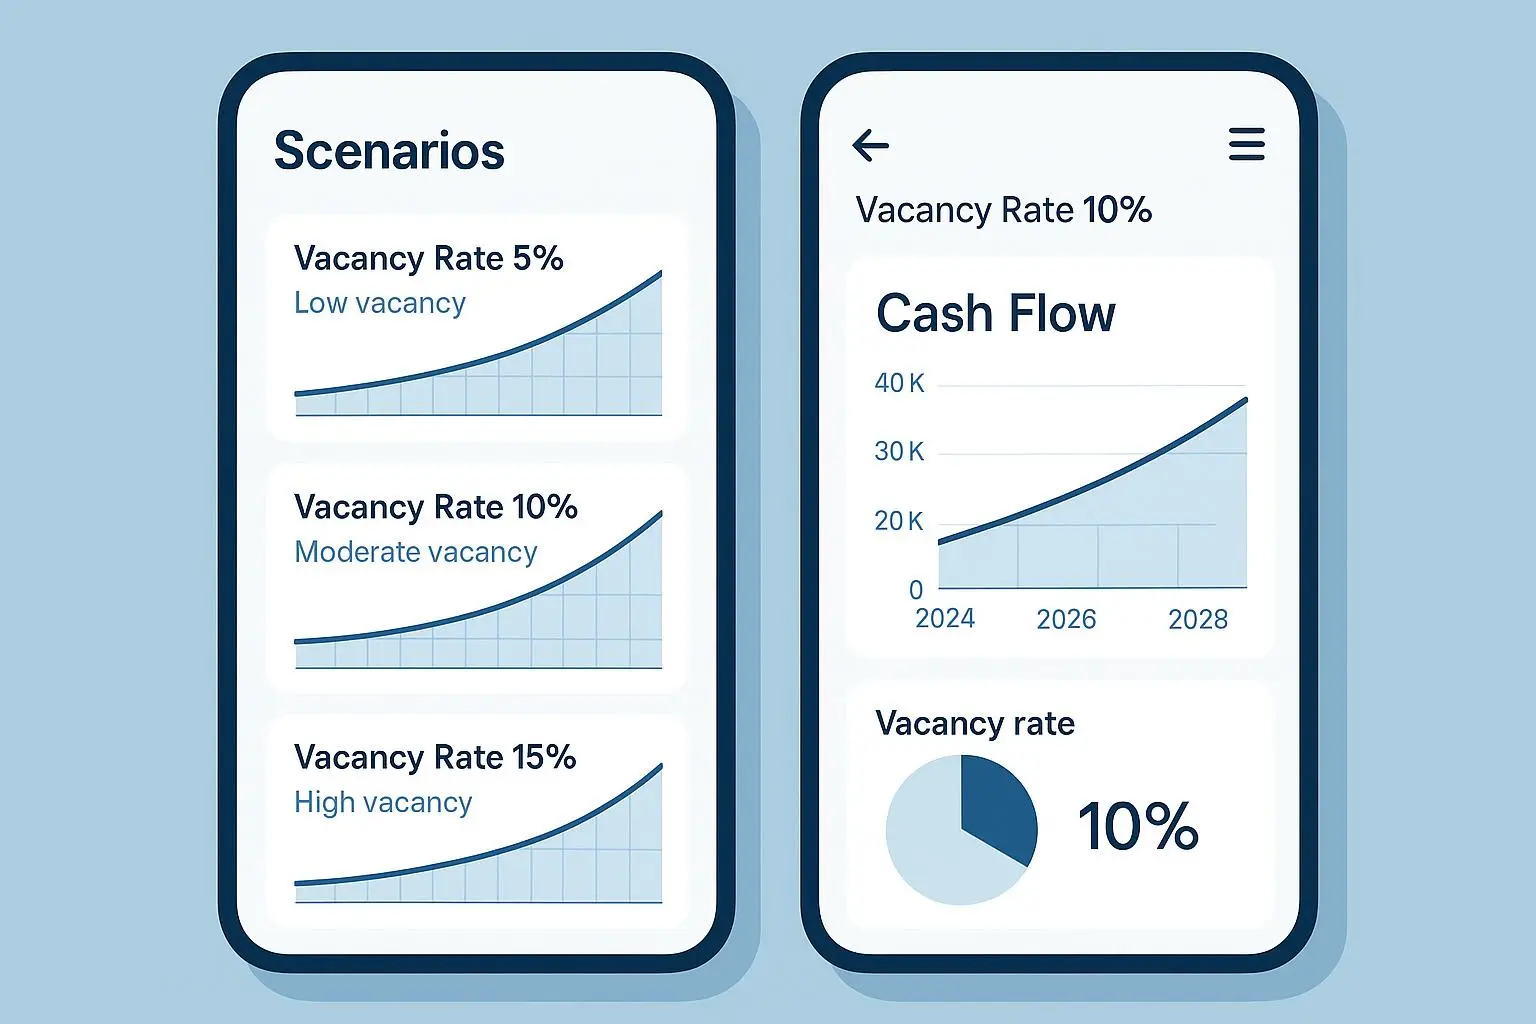
Vacancy is often the worst culprit in disguise. A flat 5% vacancy model feels safe, but it rarely matches the real world, especially in markets with cyclical employment or high turnover costs.
A better practice is to model vacancy and turnover with data-driven, localized assumptions.
- Dynamic vacancy: Don’t just pick a percent. Look at the market’s standard deviation of vacancy over the last decade. If you’re modeling the Pessimistic Case, use the 90th percentile historical vacancy for that submarket. This makes the stress test grounded in real volatility, not guesswork.
- Turnover costs: Don’t forget the cost of turnover itself—cleaning, repairs, marketing, and the rent loss during rehab. If you’re turning a unit every 12 months and it takes 3 weeks to fill, that’s months of rent lost. Build an explicit turnover cost line item and couple it with a turnover-days metric so you can stress-test different turnover speeds.
CapEx is the other big swing factor. The typical “$100 per door per month” rule is fine as a starting point for guesses, but it’s not systems-level rigorous. Treat CapEx as a schedule with components, remaining useful life, and inflation-adjusted reserves.
- CapEx reserves: Build a component schedule (roof, HVAC, water heater, appliances, exterior finishes). For each component, estimate cost to replace, remaining useful life, and inflation. Then compute an annual reserve by dividing the total replacement cost by its RUL, inflated each year.
- Black Swan reserve: Real problems like a failing foundation aren’t predictable. A conservative add-on—say 5-10% of annual CapEx, or a flat “Black Swan” buffer—often saves your cash flow when the unexpected happens.
An investor on a discussion board reminded me how easy it is to forget foundation issues or drainage problems until a remediation bill lands. If you add a small buffer now, you’re not “over-allocating” you’re simply removing excuses later.
In practice:
- Use a rolling 10-year window to calibrate vacancy and expenses, rather than a single year.
- Tie expense growth to local inflation indices, not to rent growth. Insurance, property taxes, utilities, and maintenance don’t rise exactly with rent, and your model should reflect that.
A few data-driven touchpoints that help:
- Local CPI indexing for non-rent expenses, especially property taxes, insurance, and utilities.
- Historical vacancy rate distributions for your submarket, not generic national figures.
- Turnover duration and costs by unit type (size, renovation level, and market).
This is where the numbers start to feel real. You’re not guessing; you’re anchoring to signals in the data.
3) Refine rent-growth forecasts with localized, dynamic thinking
Rent growth is the single biggest driver of long-run cash flow, yet it’s also the trickiest to forecast. Linear growth assumptions (e.g., 3% every year) are seductive but often wrong. Growth is cyclical and neighborhood-specific, driven by job creation, population shifts, and new supply.
I’ve found these three tactics keep rent forecasts honest and useful.
- Index rents to local inflation (CPI): Link expense growth to CPI, but allow rents to grow at a different pace based on submarket demand. This prevents your expenses from appearing too tame while rents soar only modestly.
- Segmented growth: Your current asset may be under-rented. Apply a higher growth rate for years 1-3 to catch up, then normalize to a long-run average for years 4-10. This approach captures “catch-up” dynamics without overstating future performance.
- Scenario-specific growth: In a Pessimistic Case, include a period of negative rent growth during an economic slowdown, then a slower but eventual recovery. This aligns with how institutional models view rent cycles in adverse periods.
The best models I’ve built don’t rely on a single forecast; they incorporate a few plausible futures and show you where your investment stands under each.
Leveraging technology without losing sight of the human
Manual spreadsheets have their place, but as you add scenarios, variables, and time horizons, they become a labyrinth. The point isn’t to automate the entire thing with fancy software. It’s to free your brain to focus on decisions, while the model handles heterogeneity and uncertainty.
There are two paths you’ll hear about most often:
- Monte Carlo simulations: Run thousands of random scenarios to map the probability distribution of outcomes. It’s powerful, but you don’t need to go all-in for every deal. Grabbing a few Monte Carlo runs on a high-stakes acquisition can be very revealing.
- Quick toggles for three scenarios: Some tools let you switch Base, Optimistic, and Pessimistic assumptions in seconds. This is a practical speed boost for deal screening, especially when you’re evaluating dozens of properties in a quarter.
The point of the tech isn’t to be flashy; it’s to remove your fear of the unknown. If you can see the probability of negative cash flow under different conditions, you can price risk more accurately and negotiate better terms.
A real-world note on tooling: a lot of the “power” comes from having a good data backbone. DealCheck has earned praise for letting you toggle between optimistic, base, and pessimistic assumptions quickly, which is exactly what you want when you’re screening several deals at once. But don’t forget a solid data source for local metrics—whether you’re pulling CPI data from the Fed or submarket vacancy from local brokerage reports.
And if you’re a spreadsheet person at heart, that’s fine. The magic happens when you combine robust data inputs with a flexible model that you can modify on the fly. A lot of successful investors keep a lean Excel or Google Sheets core, then feed in data from a handful of trusted sources to keep their inputs honest and current.
Quote from a community member on a similar approach: “The difference between a 7% projected IRR and a 5% projected IRR might not seem huge, but when you realize the 5% projection has a 90% chance of being met, and the 7% only has a 50% chance, the decision becomes clear. Advanced modeling is risk management, not just profit prediction.” It’s not rhetoric; it’s a reminder that probability should drive your decisions, not wishful thinking.
A practical walkthrough you can use this week
If you want something actionable, here’s a step-by-step you can implement in a single afternoon.
- Step 1: Collect local data for your submarket
- Vacancy rates and volatility over the last 10 years
- Local CPI or inflation benchmarks for expenses
- CapEx drivers and typical lifespans for major components (roof, HVAC, water heater)
- Step 2: Build three scenarios in your model
- Base Case: Most likely, aligned with current leases and renter demand
- Optimistic Case: 2-3% higher rent growth annually for years 1-3, vacancy at historical lows
- Pessimistic Case: Negative rent growth during a slowdown, higher CapEx, vacancy spike, turnover costs up
- Step 3: Model vacancy and turnover explicitly
- Use the 10-year standard deviation for vacancy, and the 90th percentile for the Pessimistic Case
- Add a turnover-cost line: cleaning, repairs, marketing, and the rent loss during turnover
- Step 4: Build a CapEx reserve schedule
- Create a component-by-component replacement plan with RUL
- Inflate each line item by local inflation
- Add a conservative Black Swan buffer (5-10%) on annual reserves
- Step 5: Forecast rent growth with segmentation
- Years 1-3: Higher catch-up growth if under-rented
- Years 4-10: Normalize to a long-run average
- Tie expenses (not rents) to local CPI
- Step 6: Run Monte Carlo (optional but valuable)
- Use distributions for vacancy, rent growth, and CapEx overruns
- Look at the 5th and 95th percentile outcomes to gauge risk
- Step 7: Decide with clarity
- Compare cash-on-cash, IRR, and debt-service coverage across scenarios
- If the Pessimistic Case still meets your minimum acceptable returns, consider the deal robust
- If not, tighten terms or walk away
If you’re curious about how this plays out in real deals, I’ve seen the psychology shift once the numbers show a deal can survive a realistic downturn. It’s not perfect, but it’s honest, and it gives you a framework you can defend in negotiations with lenders or equity partners.
Real-world outcomes you can expect
The point of advanced modeling isn’t to guarantee a fantasy outcome. It’s to illuminate paths you can actually defend when it matters—during underwriting, lender requests, or partner conversations.
- Better risk allocation: With explicit vacancy and CapEx stress testing, you’re better prepared to price safety margins into debt service or reserve buffers. You don’t end up “surprising” lenders with a big CapEx bill after close.
- More realistic rent growth: Localized, segmented forecasts prevent you from overreaching on cash flows in Year 5 or Year 7. You’ll have a clearer view of when appreciation or cash flow starts to plateau.
- Fewer post-close surprises: By documenting assumptions and tying them to data, you reduce the chance of a deal crumbling under scrutiny from investors who want proof you did your homework.
But let me share a quick, less-than-glam moment: after implementing a more aggressive CapEx reserve, I faced a 6-week delay in a rehab timetable due to a supplier shortage. It wasn’t catastrophic, but it challenged my cash flow in the short term. Because I’d quantified that risk up front and held a buffer, I absorbed the shock without missing a debt service payment. The lesson wasn’t “avoid delays,” it was “build a cushion you can actually rely on when the market’s noisy.”
What I learned from the crowded world of inputs
- Local data wins. Generic market figures are a blunt instrument. If you want to model truly credible risk, you must ground inputs in the submarket’s reality.
- The best models are iterative. Your first pass should be rough but honest. Each round you add more data, more components, and more nuance. The model should feel like a living thing you update quarterly.
- The goal isn’t perfection. The goal is to know where the line is for each deal—where you’re comfortable underwriting risk, where you’re prepared to negotiate, and where you walk away.
If you’re strapped for time, you can still apply the core ideas. Build three scenarios, anchor expenses to a local index, add a disciplined CapEx reserve, and introduce a simple turnover-cost line. You’ll be surprised how quickly your underwriting quality climbs.
The heavier lift: Monte Carlo and beyond
For the power user who wants to go deeper, Monte Carlo simulations offer a way to see the distribution of outcomes from a probabilistic perspective. You specify plausible distributions for vacancy, rent growth, and CapEx overruns, and the model spits back a probability curve for your IRR or cash-on-cash.
Why bother? Because deciding whether a deal is “good” becomes a probability problem, not a binary yes/no. If your 90% confidence interval centers around your minimum acceptable return, you can price risk with more confidence and negotiate better terms.
If you’re new to Monte Carlo, start small. Run 1,000 or 5,000 simulations on a single expensive acquisition and look at the tails. If the tails look uncomfortably wide, you know you’ve got work to do on your inputs.
In practice, I’ve found Monte Carlo most valuable for big acquisitions where a small percentage swing in vacancy or CapEx can shift the deal from cash-flow-positive to cash-flow-negative. It’s not always necessary for a duplex, but for multifamily deals or a value-add project with heavy CapEx, it can be the difference-maker.
How to talk about this with partners and lenders
Clear, honest communication is as important as the numbers themselves. A few practices help you bring others along without turning it into a battle.
- Show the three scenarios up front. Lenders and equity partners want to see how you handle risk. Present Base, Optimistic, and Pessimistic cases with the same metrics and the same timeline.
- Explain your inputs. People care about the data underpinning the model. Share your sources for vacancy, rent growth, and CapEx costs, and explain why you chose certain buffers.
- Be explicit about risk allocation. If you’re carrying a Black Swan CapEx reserve, tell your partner why. If you’re using a vacancy-rate stress test, explain the probability assumptions and the historical context.
- Keep it practical. Don’t drown people in tables. Use visuals—charts of cash flow under each scenario, a simple heat map showing where cash flow breaks, and a one-page executive summary that connects to the investment thesis.
The goal is to build trust, not to win an argument with fancy charts. If your partner can’t follow the logic, simplify until they can.